"I have wasted my time!" I love it! You deny validity of elections unless the results are favorable. You deny science unless it, too, is favorable. The science of global warming/climate change is clear in it's relationship to atmospheric CO2, which is supported by science, even if mankind is not the major contributor to the increasing atmospheric CO2 level.  GOOD FOR THE ECONOMY
GOOD FOR THE ENVIRONMENT October 19, 2022
As the economic costs of climate change escalate, so do the economic opportunities associated with climate action.
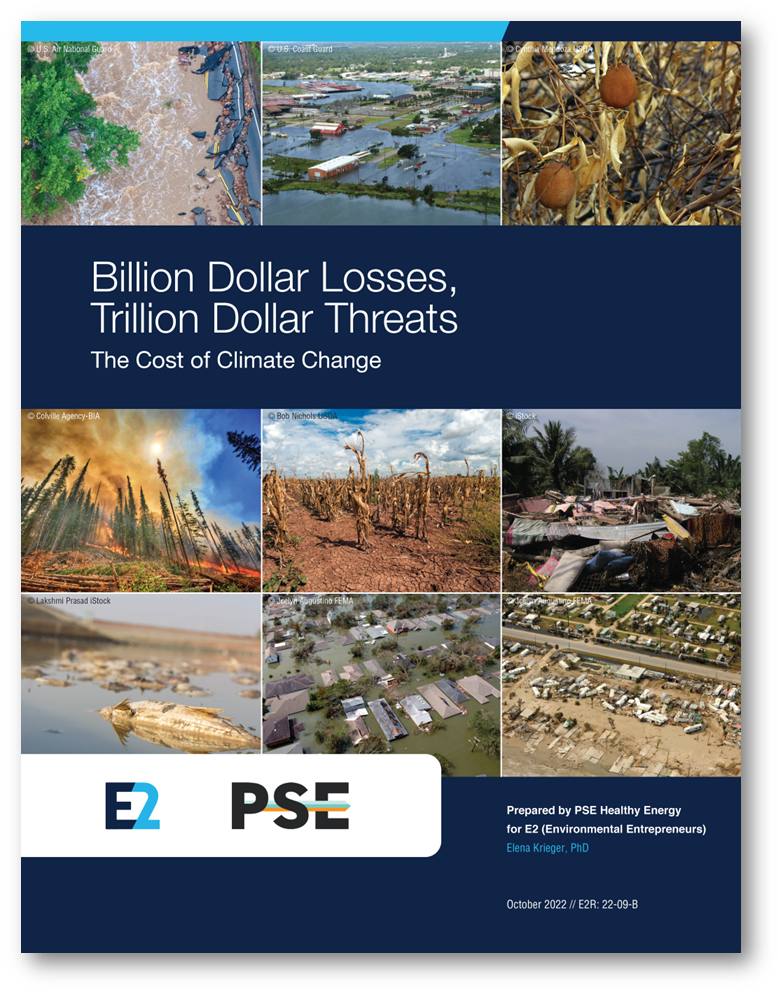
Summary:Billion Dollar Losses, Trillion Dollar Threats: The Cost of Climate Change reviews the escalating toll of billion-dollar disasters over the last forty years and provides insight into how these disasters—from hurricanes and flooding to wildfires—are compounded by other extreme weather events, such as record-breaking drought, heat waves, and rainfall. The trends identified in the report are concerning for America’s economy. Every state in the country has been impacted and faces risks from rapidly escalating weather and climate disaster damages, with a third of all losses since 1980 occurring in the last five years. From 2017-2021, America experienced its four most expensive wildfires, two of its three most expensive hurricanes, and its most expensive winter storm with economic losses from all disasters totaling $765 billion. 
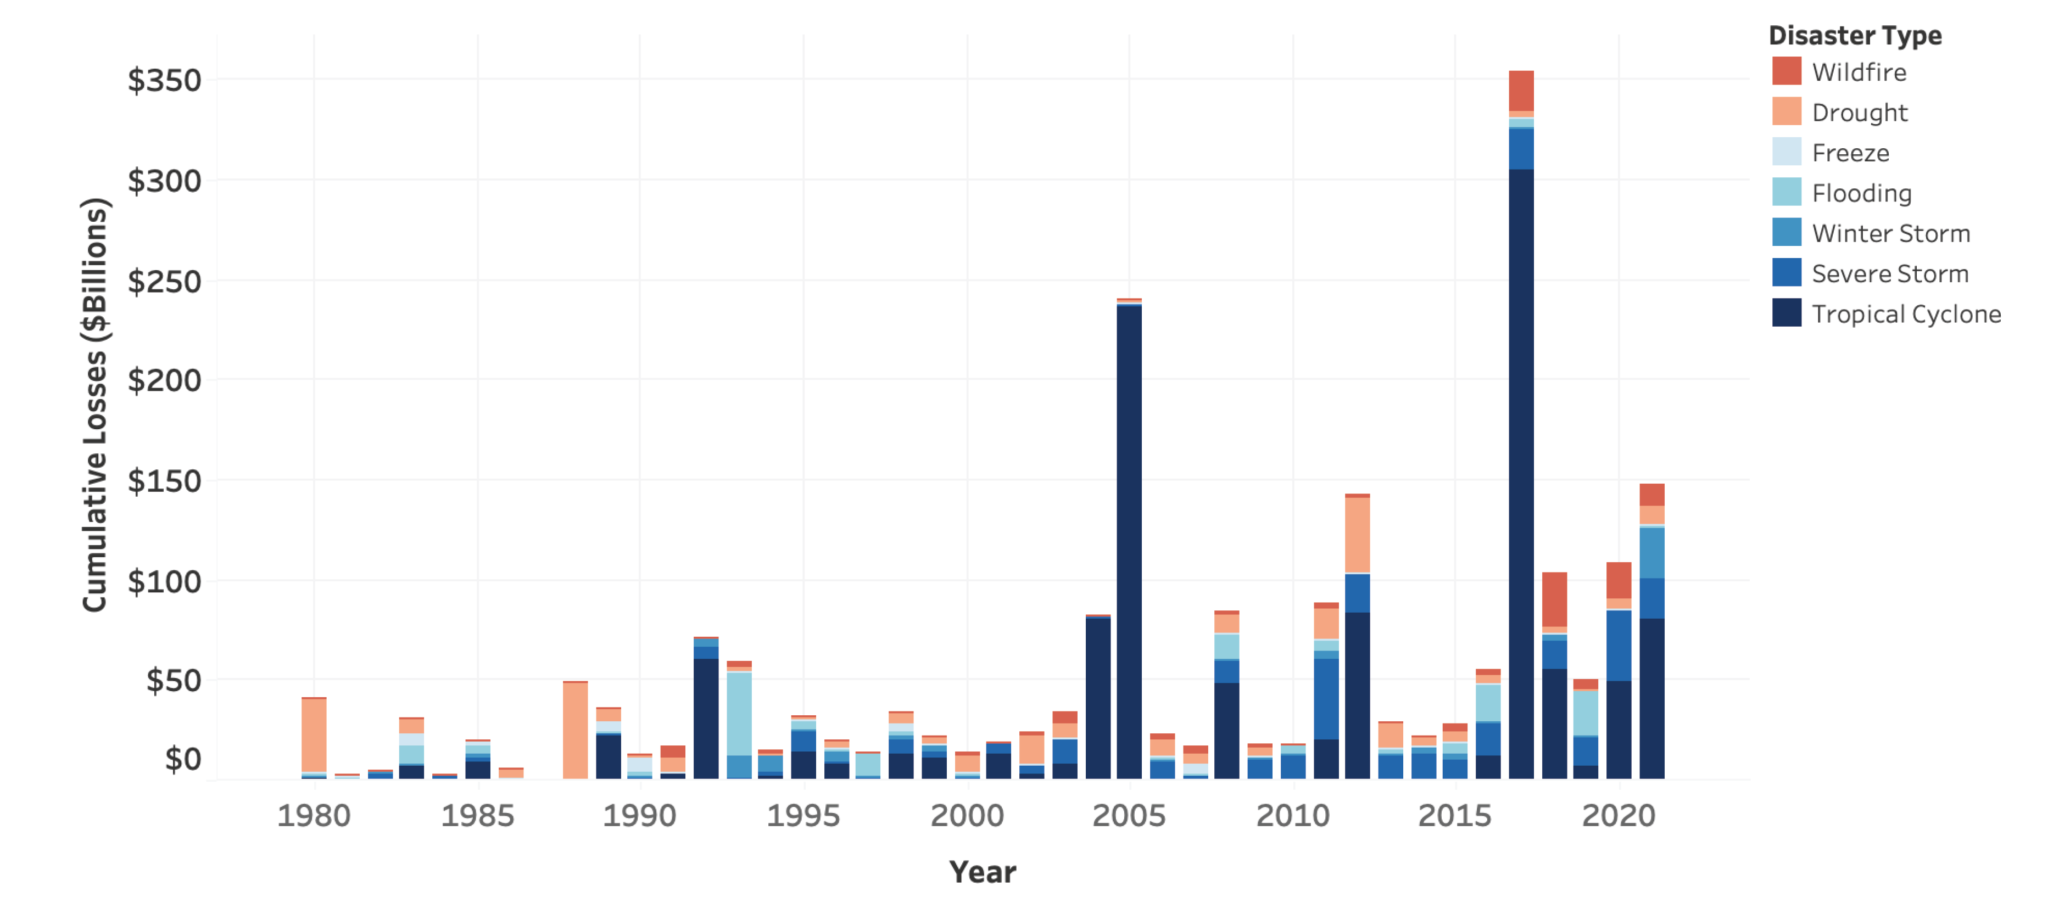
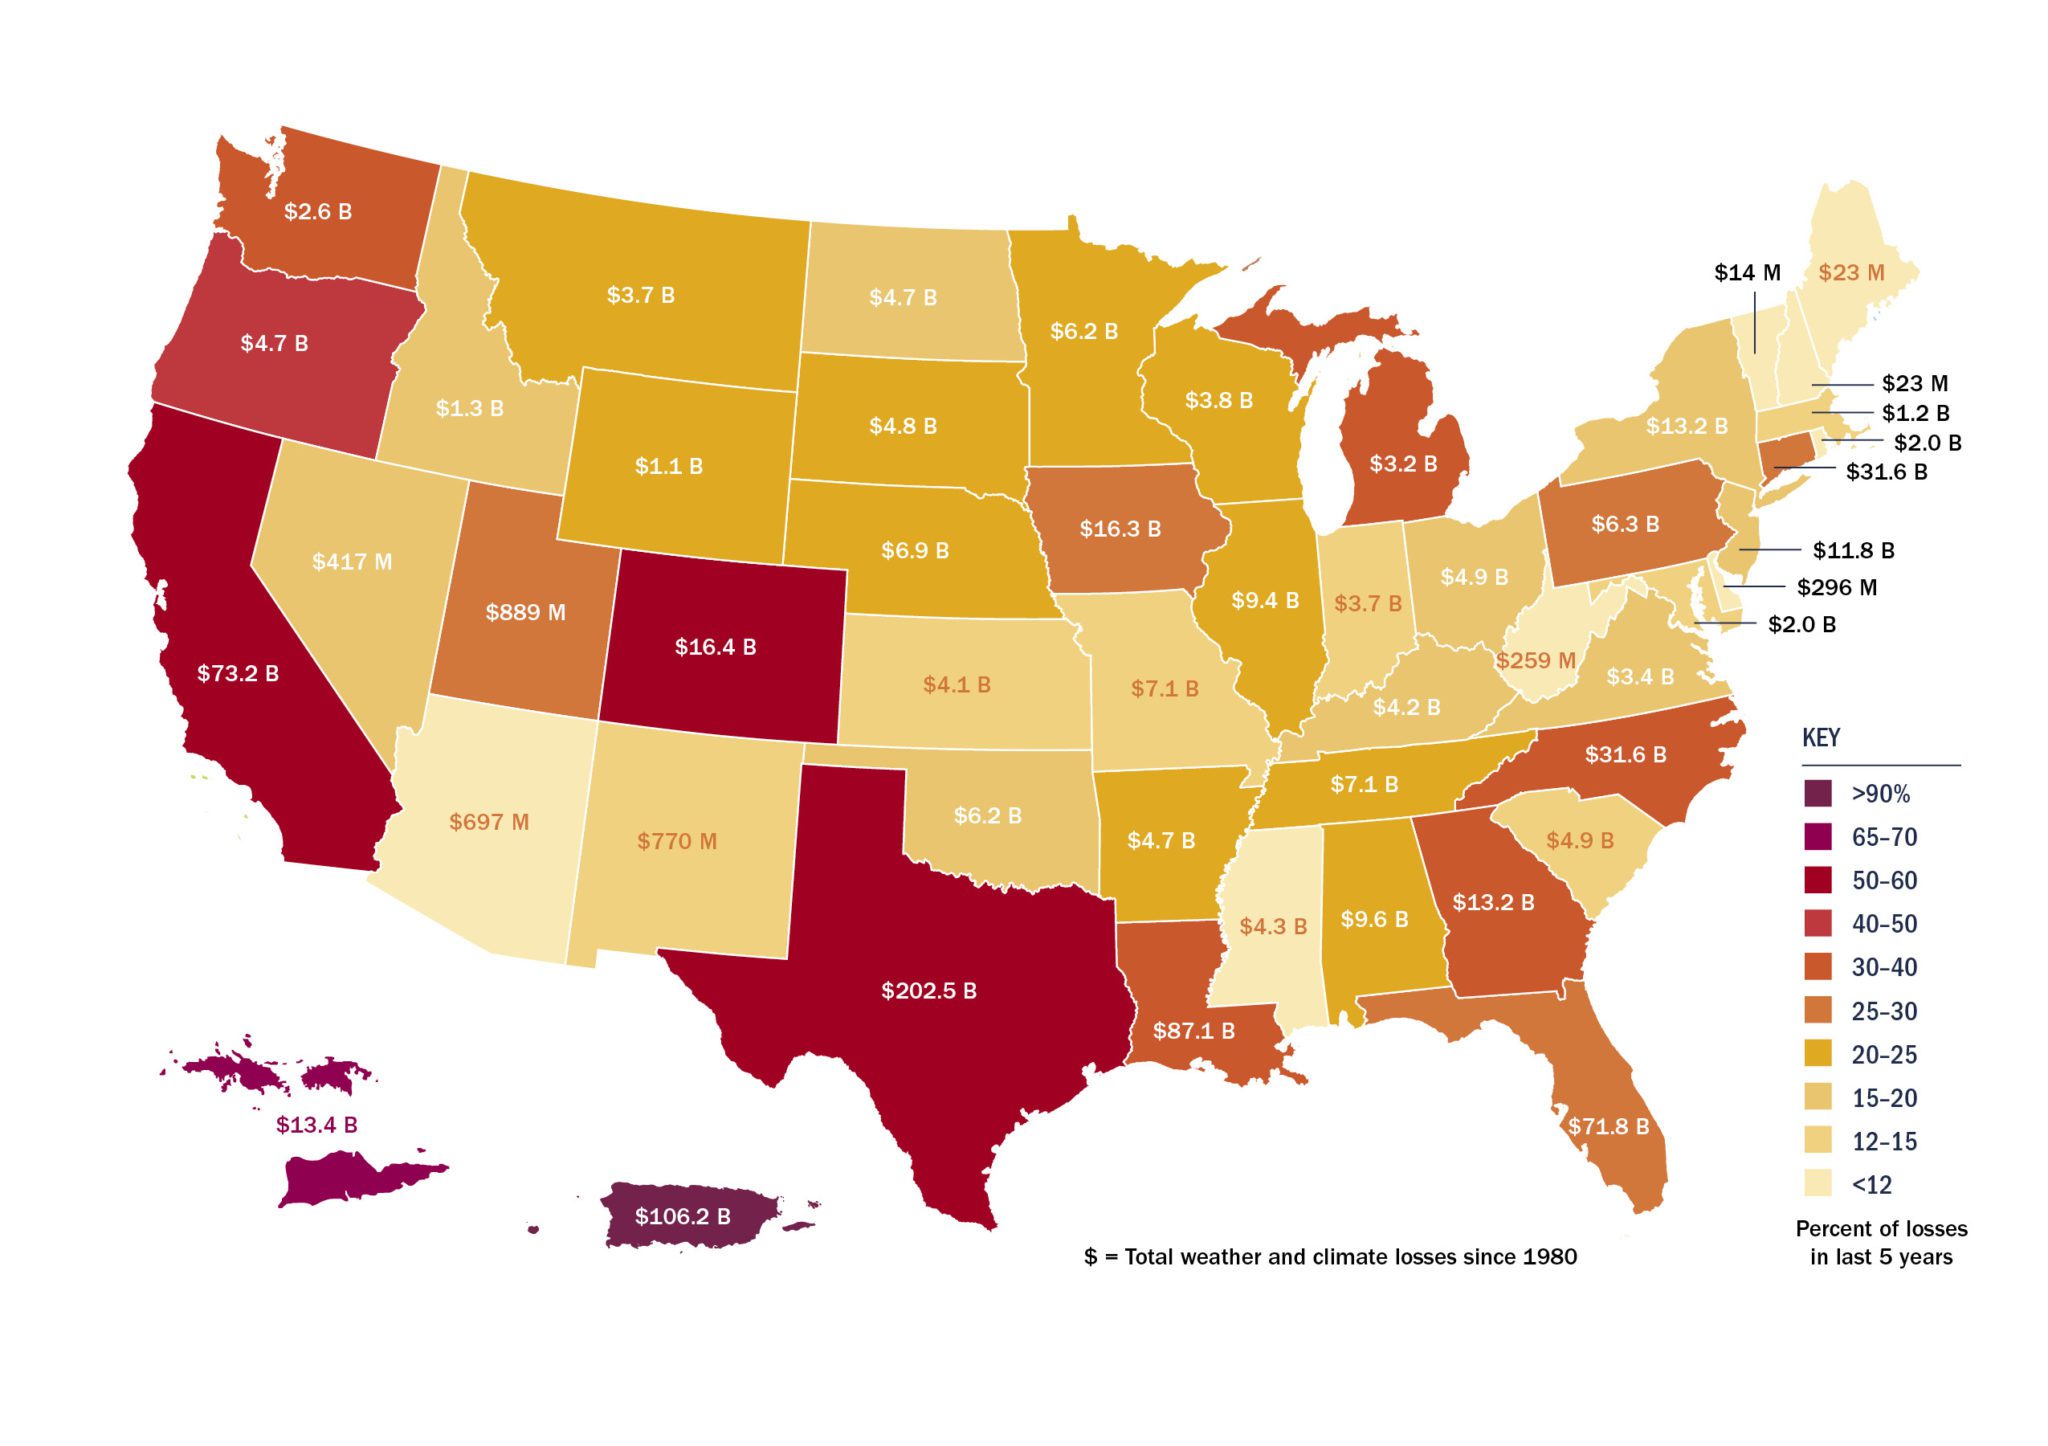
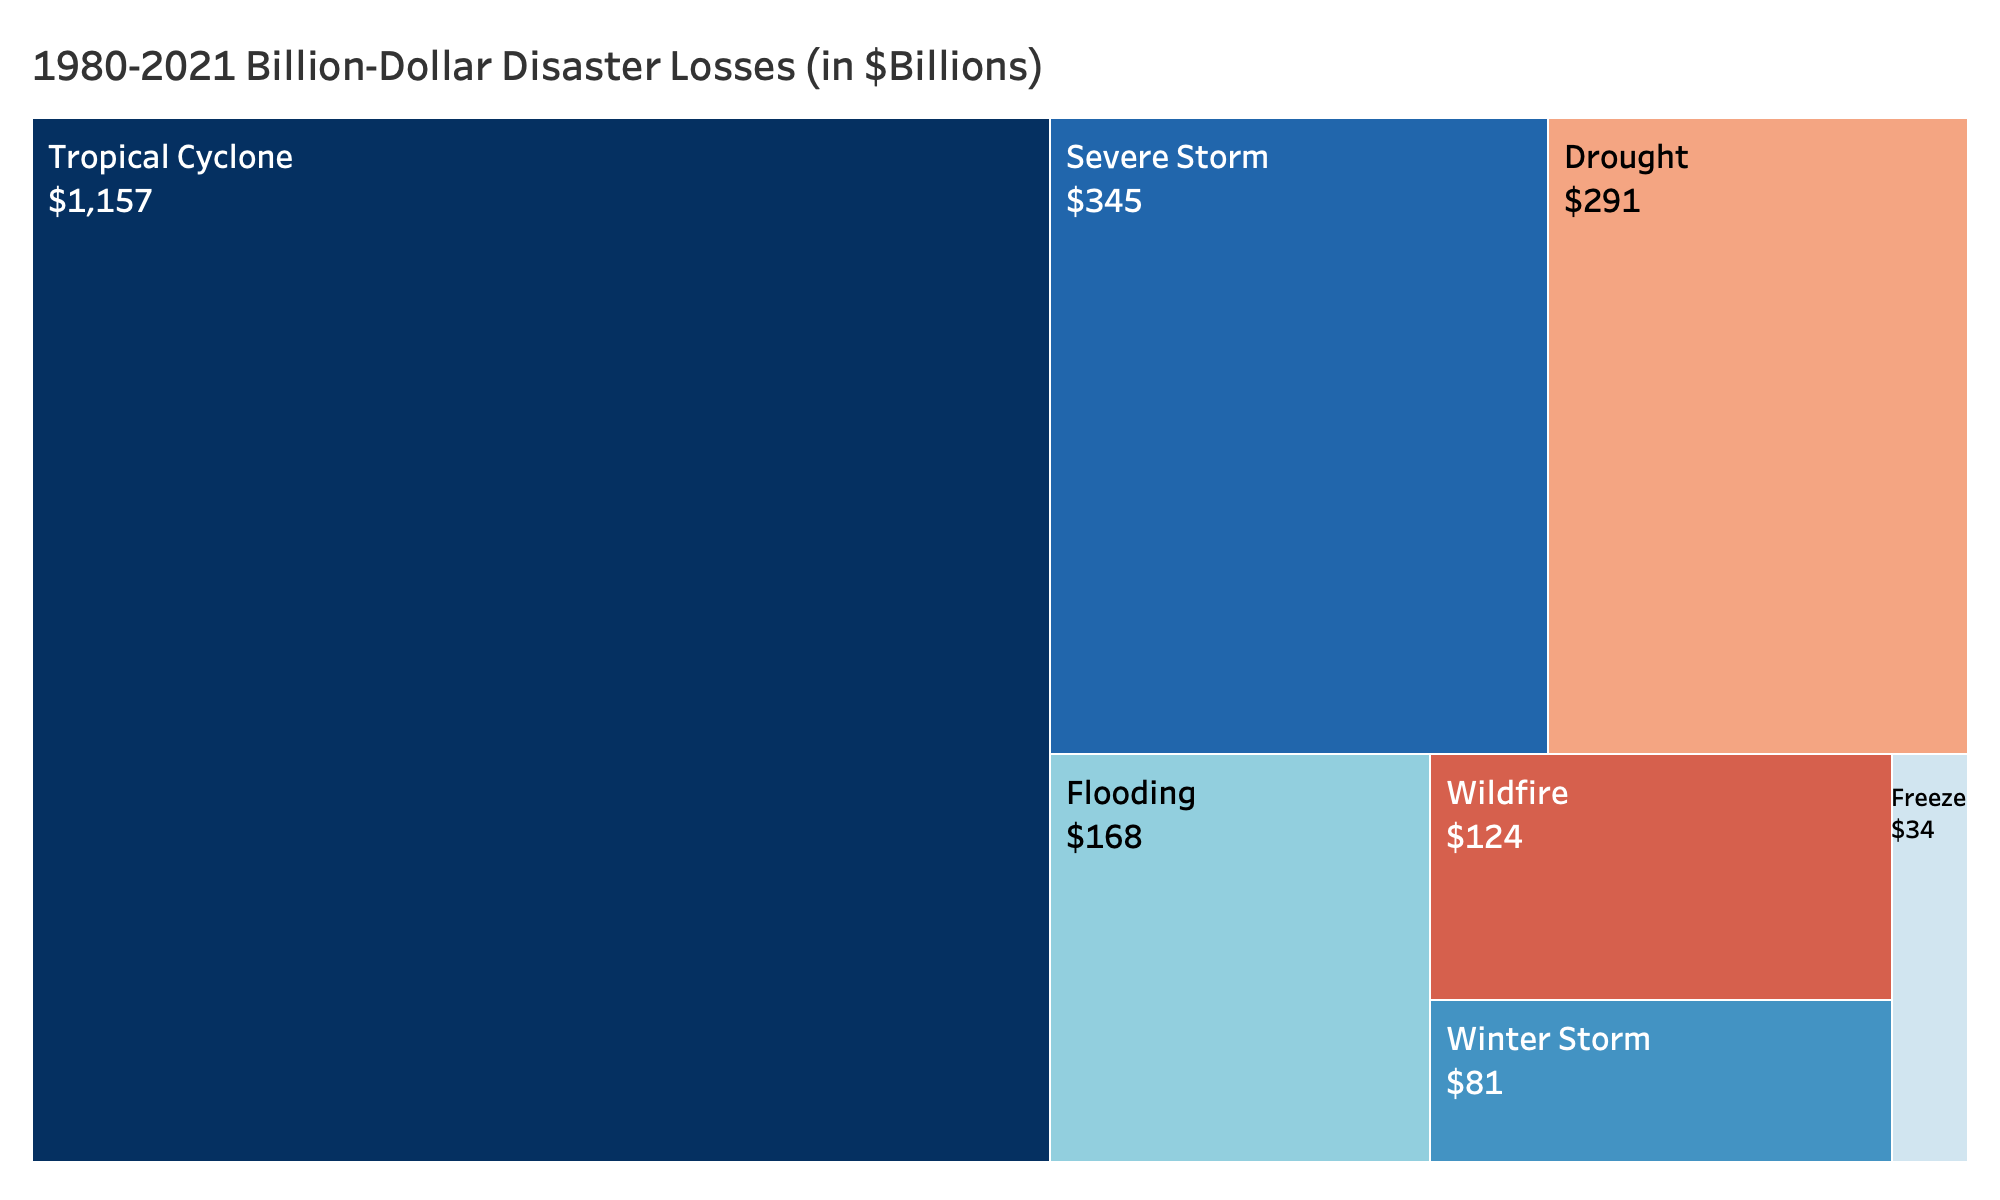
< /div> Billion-dollar weather and climate disasters in the form of hurricanes, severe storms, drought, flooding, wildfires, winter storms, and freezing have led to $2.2 trillion in losses since 1980 (see Figure 1) (NOAA, 2022). Across the United States, climate change is exacerbating extreme weather events and severely damaging infrastructure, buildings, roads, and cropland. Annual losses from billion-dollar disasters during the last five years—totalling $765 billion in losses and more than 4,500 deaths from 2017 to 2021—were nearly eight times higher than in the 1980s (NOAA, 2022). While billion-dollar disasters are responsible for an estimated 80 percent of total disaster-related losses, the combination of smaller disasters, heat waves, and ongoing business disruptions that are not captured mean the overall economic turmoil is even greater than this analysis details. Climate change is not the sole driver of natural disasters, but it contributes to their frequency and severity. The world has warmed nearly 1.1 ˚C since 1880 (NASA, 2022), and warming is likely to exceed 1.5 ˚C in the near term, even with significant efforts to curb greenhouse gas emissions (Pörtner, 2022). Each year from 2001 through 2021 were among the 22 hottest years on record (NASA, 2022), and record-breaking temperatures led to a new high of 130 ˚F in Death Valley in 2021.1 These extreme weather events have widespread impacts: a recent analysis from the Washington Post estimated that in 2021 alone, a federal disaster emergency was declared in the home county of more than 40 percent of Americans (Kaplan et al., 2022). The frequency of climate-related disasters are rising, too. Between 2017 and 2021, the United States experienced its four most-expensive wildfires, two of its three most expensive hurricanes, and its most expensive winter storm (NOAA, 2022). The percentage of state’s total historic weather and climate disaster losses that occurred in the last 5 years is shown in Figure 3. Figure 1 // Billion-dollar disasters across the U.S. are growing in number and severity (data source: NOAA, 2022). Figure 3 // Percentage of state’s total historic losses from weather and climate disasters in last 5 years (total losses shown in text) (data source: NOAA, 2022). Figure 2 // Billion-dollar climate- and weather-related disasters accounted for 80 percent of disaster-related losses, totaling $2.2 trillion from 1980-2021 (shown in $billions below).
 (data source: NOAA, 2022). This report reviews the historic and projected economic toll of weather and climate disasters across the United States since 1980. It assess trends related to specific types of disasters—such as wildfires or hurricanes—as well as across regions, sectors, and over the course of decades. Such an analysis inherently reflects uncertainty associated with both historic impacts, for which data can be limited, as well as for future projections, which depend on future emissions scenarios and complex climate modeling. This analysis largely discusses total economic impacts of these disasters, but this metric is somewhat limited as well: it may be much harder for a low-income household to recover from the flooding of a less expensive house than for a wealthier household to recover from damage to a more expensive house, even if the total monetary damage of the latter is larger. Given these limitations, the report still aims to summarize the scale of weather and climate damage across the United States, the risk of escalating costs in a warming climate, and the need to rapidly invest in both climate mitigation and adaptation. Low-income communities, communities of color, and other historically underserved and overburdened face elevated risks from climate change. Recent research has found that future flooding is more likely to occur in low-income neighborhoods, communities of color, and places with a disproportionate share of industrial pollution (Marlow, 2022). Historically redlined communities which are still disproportionately home to people of color are more likely to be heat islands today (Plumer & Popovich, 2020), increasing risks for these populations as temperatures rise. Not addressing these inequities in climate policy risks exacerbating environmental health and socioeconomic inequities (Shonkoff et al, 2011), but targeted investments co-designed with communities can help reduce the disproportionate impacts of extreme weather (NASEM, 2022). |